
CLASS:BCA 6THSem
Batch: 2018-21
Computer Graphics
Notes as per IKGPTU Syllabus
Name of Faculty: Mr/Ms<<<<<Jatinderpal kaur>>>
Faculty of Computer Applictions,SBS College. Ludhiana
Syllabus
SECTION-A
Introduction to Active and PassiveGraphics, Applications of Computer Graphics. Inputdevices:lightpens,Graphic tablets,Joysticks,Trackball,Data Glove,Digitizers,Image scanner, Graphs and Types of Graphs.
Video DisplayDevices– Refresh Cathode Ray Tube, Raster Scan displays, Random Scan displays, ArchitectureofRasterandRandomScanMonitors,ColorCRT-monitorsand Colorgenerating techniques (Shadow Mask, Beam Penetration) , Direct View Storage Tube, Flat-Panel Displays; 3-D Viewing Devices, Raster Scan Systems, Random Scan Systems,Graphicsmonitors and workstations, ColorModels
(RGBand CMY),Lookup Table.
SECTION-B
ProcessandneedofScanConversion,ScanconversionalgorithmsforLine,CircleandEllipse,effectof scanconversion,Bresenham’salgorithmsforlineandcirclealongwiththeirderivations,MidpointCircle
Algorithm,Area fillingtechniques, flood fill techniques, charactergeneration.
SECTION-C
- DimensionalGraphics:Cartesian andneedof Homogeneous co-ordinate system,Geometric transformations(Translation, Scaling,Rotation,Reflection,Shearing),Two-dimensionalviewing transformationandclipping (line,polygonandtext),CohenSutherland, SutherlandHodgemanandLiang Barskyalgorithm for clipping.
SECTION-D
Introduction to 3-dimensional Graphics:GeometricTransformations (Translation, Scaling, Rotation, Reflection,Shearing),Mathematicsof Projections(parallel& perspective).Introductionto3-Dviewing transformations and clipping.
| Sr No. | Topic | Page No. |
| 1 | Introduction to Active and PassiveGraphics, | 5 |
| 2 | Applications of Computer Graphics | 7-8 |
| 3 | Inputdevices | 9-10 |
| 4 | Video DisplayDevices | 11-34 |
| 5 | ColorModels | 35 |
| 6 | Lookup Table | 36 |
| 7 | ProcessandneedofScanConversion, | 37 |
| 8 | ScanconversionalgorithmsforLine, | 39 |
| 9 | CircleandEllipse,effectof scanconversion | 40 |
| 10 | ,Bresenham’salgorithmsforlineandcirclealongwiththeirderivations | 41-53 |
| 11 | Area fillingtechniques, flood fill techniques | 54-65 |
| 12 | charactergeneration | 65-68 |
| 13 | 2DimensionalGraphics: Cartesian andneedof Homogeneous co-ordinate system | 68-71 |
| 14 | Transformations(Translation, Scaling,Rotation,Reflection,Shearing) | 71-90 |
| 15 | Clipping | 90-101 |
| 16 | Introduction to 3-dimensional Graphics | 101-108 |
| 17 | Projections | 108-110 |
| 18 | Introductionto3-Dviewing transformations and clipping | 110-112 |
| 19 | Important Questions | 113-144 |
Unit-1
Computer graphics
Computer graphics are pictures and films created using computers. Usually, the term refers to computer-generated image data created with the help of specialized graphical hardware and software.
Types of Computer Graphics
Interactive Computer Graphics: Interactive Computer Graphics involves a two way communication between computer and user. Here the observer is given some control over the image by providing him with an input device for example the video game controller of the ping pong game. This helps him to signal his request to the computer.
Passive(Non-Interactive) Graphics
Passive Graphics computer graphics otherwise known as passive computer graphics. it is the computer graphics in which user does not have any kind of control over the image. The image is totally under the control of program instructions not under the user. Example: screen savers
Interactive vs Passive Graphics
| Interactive Graphics | Passive(Non interactive) Graphics |
| User have Full control on Graphics | User have no control on Graphics |
| It is provide two way communication | It is provide one way communication |
| It is not provide interaction between user and hardware | It is provide interaction between user and hardware |
| It used in Earlier Applications | It used in Modern Applications |
| It is not provide 2D,3D updation and motion | It is provide 2D,3D updation and motion |
Application of Computer Graphics
- Computational Biology: Computational biology is an interdisciplinary field that applies the techniques of computer science, applied mathematics and statistics to address biological problems. The main focus lies on developing mathematical modeling and computational simulation techniques.
- Computational Physics: Computational physics is the study and implementation of numerical algorithm to solve problems in physics for which a quantitative theory already exists. It is often regarded as a sub discipline of theoretical physics but some consider it an intermediate branch between theoretical and experimental physics.
- Information of Graphics: Information graphics or information graphics are visual representations of information, data or knowledge. These graphics are used where complex information needs to be explained quickly and clearly, such as in signs, maps, journalism, technical writing, and education. They are also used extensively as tools by computer scientists, mathematicians, and statisticians to ease the process of developing and communicating conceptual information.
- Scientific Visualization: Scientific visualization is a branch of science, concerned with the visualization of three dimensional phenomena, such as architectural, meteorological, medical, biological systems. Scientific visualization focuses on the use of computer graphics to create visual images which aid in understanding of complex, often massive numerical representation of scientific concepts or results.
- Graphic Design: The term graphic design can refer to a number of artistic and professional disciplines which focus on visual communication and presentation. Various methods are used to create and combine symbols, images and/or words to create a visual representation of ideas and messages. Graphic design often refers to both the process (designing) by which the communication is created and the products (designs) which are generated.
- Computer-aided Design: Computer-aided design (CAD) is the use of computer technology for the design of objects, real or virtual. The design of geometric models for object shapes, in particular, is often called computer-aided geometric design (CAGD). CAD may be used to design curves and figures in two-dimensional (“2D”) space; or curves, surfaces, or solids in three-dimensional (“3D”) objects. CAD is also widely used to produce computer animation for special effects in movies, advertising, technical manuals.
- Web Design: Web design is the skill of designing presentations of content usually hypertext or hypermedia that is delivered to an end-user through the World Wide Web, by way of a Web browser. The process of designing Web pages, Web sites, Web applications or multimedia for the Web may utilize multiple disciplines, such as animation, authoring, communication design, corporate identity, graphic design, human-computer interaction, information architecture, interaction design, marketing, photography, search engine optimization and typography.
- Digital Art: Digital art most commonly refers to art created on a computer in digital form. On other hand, is a term applied to contemporary art that uses the methods of mass production or digital media. The impact of digital technology has transformed traditional activities such as painting, drawing and sculpture, while new forms, such as net art, digital installation art, and virtual reality, have been recognized artistic practices.
- Video Games: A video game is an electronic game that involves interaction with a user interface to generate visual feedback on a raster display device. The electronic systems used to play video games are known as platforms. This platform creates through graphics.
- Virtual Reality: Virtual reality (VR) is a technology which allows a user to interact with a computer-simulated environment. The simulated environment can be similar to the real world, for example, simulations for pilot or combat training, or it can differ significantly from reality, as in VR games. It is currently very difficult to create a high-fidelity virtual reality experience, due largely to technical limitations on processing power, image resolution and communication bandwidth. Virtual Reality is often used to describe a wide variety of applications, commonly associated with its immersive, highly visual, 3D environments.
- Computer Simulation: A computer simulation, a computer model or a computational model is a computer program, or network of computers, that attempts to simulate an abstract model of a particular system.
- Education: A computer simulation, a computer model or a computational model is a computer program, or network of computers, that attempts to simulate an abstract model of a particular system. Computer simulations have become a useful part of mathematical modeling of many natural systems in physics (computational physics), chemistry and biology, human systems in economics, psychology, and social science and in the process of engineering new technology, to gain insight into the operation of those systems, or to observe their behavior.
- Information Visualization: Information visualization is the study of the visual representation of large-scale collections of non-numerical information, such as files and lines of code in software systems, and the use of graphical techniques to help people understand and analyze data.
The computer-generated images we see on television and in movies have advanced to the point that they are almost indistinguishable from real-world images. Computer graphics become a power field for the production of pictures. There are no areas in which graphical displays can’t be used to some advantages, so it is not surprising to find the use of computer graphics so widespread.
Input devices
Light Pen
Light pen is a pointing device similar to a pen. It is used to select a displayed menu item or draw pictures on the monitor screen. It consists of a photocell and an optical system placed in a small tube.
When the tip of a light pen is moved over the monitor screen and the pen button is pressed, its photocell sensing element detects the screen location and sends the corresponding signal to the CPU.

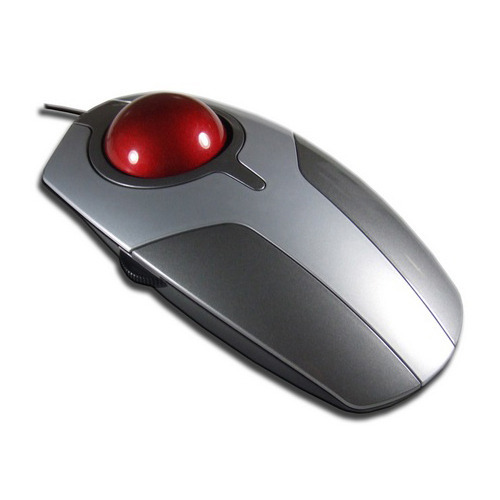
Track Ball
Track ball is an input device that is mostly used in notebook or laptop computer, instead of a mouse. This is a ball which is half inserted and by moving fingers on the ball, the pointer can be moved.
Since the whole device is not moved, a track ball requires less space than a mouse. A track ball comes in various shapes like a ball, a button, or a square.
Scanner
Scanner is an input device, which works more like a photocopy machine. It is used when some information is available on paper and it is to be transferred to the hard disk of the computer for further manipulation.
Scanner captures images from the source which are then converted into a digital form that can be stored on the disk. These images can be edited before they are printed.
Digitizer
Digitizer is an input device which converts analog information into digital form. Digitizer can convert a signal from the television or camera into a series of numbers that could be stored in a computer. They can be used by the computer to create a picture of whatever the camera had been pointed at.
Digitizer is also known as Tablet or Graphics Tablet as it converts graphics and pictorial data into binary inputs. A graphic tablet as digitizer is used for fine works of drawing and image manipulation applications.
Data glove
A data glove is an interactive device, resembling a glove worn on the hand, which facilitates tactile sensing and fine-motion control in robotics and virtual reality. Data gloves are one of several types of electromechanical devices used in haptics applications.
Tactile sensing involves simulation of the sense of human touch and includes the ability to perceive pressure, linear force, torque, temperature, and surface texture. Fine-motion control involves the use of sensors to detect the movements of the user’s hand and fingers, and the translation of these motions into signals that can be used by a virtual hand (for example, in gaming) or a robotic hand (for example, in remote-control surgery).
Within a virtual reality room or other VR environment, a data glove can allow you to interact normally with objects — turning doorknobs, for example — and receive haptic feedback to replicate grasping a doorknob and feeling the object in your hand rather than just making a gesture in air. Haptic feedback is essential to immersiveness, which enables user engagement in virtual environments, particularly for applications like VR gaming.
Digitizer tablet (digitizer or graphics tablet)
A digitizer tablet (also known as a digitizer or graphics tablet) is a tool used to convert hand-drawn images into a format suitable for computer processing. Images are usually drawn onto a flat surface with a stylus and then appear on a computer monitor or screen. Digitizer tablets can also be used as an input device, receiving information represented in drawings and sending output to a CAD (computer aided design) application and PC-based software like AutoCAD.
Digitizers are often used along with takeoff software because they can quickly measure, transfer and store quantities seen on a blueprint. Additional benefits are found in features such as a dimension list, which can be saved and used for a future estimate.
Digitizer tablets are compatible with most digitizer software programs that have a 32-bit WinTAB driver.
Graph
A graph can be defined as a pictorial representation or a diagram that represents data or values in an organized manner. The points on the graph often represent the relationship between two or more things
Types of Graphs
Though, there are a lot of different types of graphs depending upon the number of vertices, number of edges, interconnectivity, and their overall structure, some of such common types of graphs are as follows:
- Null Graph
A null graph is a graph in which there are no edges between its vertices. A null graph is also called empty graph.
- Trivial Graph
A trivial graph is the graph which has only one vertex.
Example
In the above graph, there is only one vertex ‘v’ without any edge. Therefore, it is a trivial graph.
- Simple Graph
A simple graph is the undirected graph with no parallel edges and no loops.
A simple graph which has n vertices, the degree of every vertex is at most n -1.
Example
In the above example, First graph is not a simple graph because it has two edges between the vertices A and B and it also has a loop.
Second graph is a simple graph because it does not contain any loop and parallel edges.
- Undirected Graph
An undirected graph is a graph whose edges are not directed.
Example
In the above graph since there is no directed edges, therefore it is an undirected graph.
- Directed Graph
A directed graph is a graph in which the edges are directed by arrows.
Directed graph is also known as digraphs.
Example
In the above graph, each edge is directed by the arrow. A directed edge has an arrow from A to B, means A is related to B, but B is not related to A.
- Complete Graph
A graph in which every pair of vertices is joined by exactly one edge is called complete graph. It contains all possible edges.
A complete graph with n vertices contains exactly nC2 edges and is represented by Kn.
Example
In the above example, since each vertex in the graph is connected with all the remaining vertices through exactly one edge therefore, both graphs are complete graph.
- Connected Graph
A connected graph is a graph in which we can visit from any one vertex to any other vertex. In a connected graph, at least one edge or path exists between every pair of vertices.
Example
In the above example, we can traverse from any one vertex to any other vertex. It means there exists at least one path between every pair of vertices therefore, it a connected graph.
- Disconnected Graph
A disconnected graph is a graph in which any path does not exist between every pair of vertices.
Example
The above graph consists of two independent components which are disconnected. Since it is not possible to visit from the vertices of one component to the vertices of other components therefore, it is a disconnected graph.
- Regular Graph
A Regular graph is a graph in which degree of all the vertices is same.
If the degree of all the vertices is k, then it is called k-regular graph.
Example
In the above example, all the vertices have degree 2. Therefore they are called 2- Regular graph.
Video Display Devices
Computer Graphics | Cathode ray tube (video display device)
Computer Graphics has become a common element in today’s modern world. Be it in user interfaces, or data visualization, motion pictures etc, computer graphics plays an important role. The primary output device in a graphics system is a video monitor. Although many technologies exist, but the operation of most video monitors is based on the standard Cathode Ray Tube (CRT) design.
Cathode Ray Tubes (CRT) –
A cathode ray tube (CRT) is a specialized vacuum tube in which images are produced when an electron beam strikes a phosphorescent surface.It modulates, accelerates, and deflects electron beam(s) onto the screen to create the images. Most desktop computer displays make use of CRT for image displaying purposes.
Construction of a CRT –
- The primary components are the heated metal cathode and a control grid.
- The heat is supplied to the cathode (by passing current through the filament). This way the electrons get heated up and start getting ejected out of the cathode filament.
- This stream of negatively charged electrons is accelerated towards the phosphor screen by supplying a high positive voltage.
- This acceleration is generally produced by means of an accelerating anode.
- Next component is the Focusing System, which is used to force the electron beam to converge to small spot on the screen.
- If there will not be any focusing system, the electrons will be scattered because of their own repulsions and hence we won’t get a sharp image of the object.
- This focusing can be either by means of electrostatic fields or magnetic fields.
Types Of Deflection:
- Electrostatic Deflection –
The electron beam (cathode rays) passes through a highly positively charged metal cylinder that forms an electrostatic lens. This electrostatic lens focuses the cathode rays to the center of the screen in the same way like an optical lens focuses the beam of light. Two pairs of parallel plates are mounted inside the CRT tube. - Magnetic Deflection –
Here, two pairs of coils are used. One pair is mounted on the top and bottom of the CRT tube, and the other pair on the two opposite sides. The magnetic field produced by both these pairs is such that a force is generated on the electron beam in a direction which is perpendicular to both the direction of magnetic field, and to the direction of flow of the beam. One pair is mounted horizontally and the other vertically.
Raster Scan
In a raster scan system, the electron beam is swept across the screen, one row at a time from top to bottom. As the electron beam moves across each row, the beam intensity is turned on and off to create a pattern of illuminated spots.
Picture definition is stored in memory area called the Refresh Buffer or Frame Buffer. This memory area holds the set of intensity values for all the screen points. Stored intensity values are then retrieved from the refresh buffer and “painted” on the screen one row (scan line) at a time as shown in the following illustration.
Each screen point is referred to as a pixel (picture element) or pel. At the end of each scan line, the electron beam returns to the left side of the screen to begin displaying the next scan line.
Random Scan (Vector Scan)
In this technique, the electron beam is directed only to the part of the screen where the picture is to be drawn rather than scanning from left to right and top to bottom as in raster scan. It is also called vector display, stroke-writing display, or calligraphic display.
Picture definition is stored as a set of line-drawing commands in an area of memory referred to as the refresh display file. To display a specified picture, the system cycles through the set of commands in the display file, drawing each component line in turn. After all the line-drawing commands are processed, the system cycles back to the first line command in the list.
Random-scan displays are designed to draw all the component lines of a picture 30 to 60 times each second.
Architecture and components of Raster-Scan Systems
Raster-scan Systems:
An application program is input and stored in the system memory along with a graphics package. Graphics commands in the program are translated by the graphics package into a display file stored in the system memory. This display file is then accessed by the display processor to refresh the screen. The display processor cycles through each command in the display file program once during every refresh cycle. Sometimes the display processor in a random-scan system is refreshed to as a display processing unit or a graphics controller.
Graphic patterns are drawn on a random scan system by directing the electron beam along the component lines of the picture. Lines are defined by the values for their co-ordinate endpoints, and these input co-ordinate values are converted to x and y deflection voltages. A scene is then drawn one line at a time by positioning the beam to fill in the line between specified endpoints.
Video Controller
A fixed area of the system memory is reserved for the frame buffer, and the video controller is given direct access to the frame buffer memory. The co-ordinates of the graphics monitor starts at the lower left screen corner. Positive x values increasing to the right and y values increasing from bottom to top.
The above diagram shows the refresh operation of video controller. Two registers are used to store the co-ordinates of the screen pixels. Initially x=0 and y=ymax. The value stored in the frame buffer corresponding to this pixel position is retrieved. And the x value is incremented by 1 and the corresponding y value is retrieved, like that the pixel values are retrieved line by line. Once the last pixel is reached again the registers are reset to initial value to repeat the process.
It consists of raster-scan generator, x and y address registers and pixel value register. The raster-scan generator produces deflection signals that generate the raster scan. The raster scan generator also controls the x and y address registers which in turn define the memory location to be accessed next. Frame buffer locations, and the corresponding screen positions, are referenced in Cartesian coordinates. For many graphics monitors, the coordinate origin is defined at the lower left screen corner. The screen surface is then represented as the first quadrant of a two-dimensional system, with positive x values increasing to the right and positive y values increasing from bottom to top. (On some personal computers, the coordinate origin is referenced at the upper left comer of the screen, so the y values are inverted.) Scan lines are then labeled from y, at the top of the screen to 0 at the bottom. Along each scan line, screen pixel positions are labeled from 0 to xmax. During each fetch the pixel value is read and is used to control the intensity of the CRT beam
Display Processor
The purpose of the display processor or graphics controller is to free the CPU from the graphics chores. In addition to the system memory a separate display processor memory area can also provided.
Architecture and components of Random-Scan Displays
Random scan monitors draw a picture one line at a time and for this reason are also referred to as vector displays (or stroke-writing or calligraphic displays).The component lines of a picture can be drawn and refreshed by a random-scan system in any specified order .
Refresh rate on a random-scan system depends on the number of lines to be displayed . Picture definition is now stored as a set of line-drawing commands in an area of memory referred to as the refresh display file. Sometimes the refresh display file is called the display list, display program, or simply the refresh buffer. To display a specified picture, the system cycles through the set of commands in the display file, drawing each component line in turn. After all line- drawing commands have been processed, the system cycles back to the first line command in the list. Random-scan displays are designed to draw al the component lines of a picture 30 to 60times each second.
Scan conversion functionality is implemented using programmed logic array or microcode in this display system. Random scan display processor is called display processing unit (DPU)/Graphics controller. DPU has instruction set and instruction address register and guess through the classic instruction fetch, decode, execute cycle found in any computer. It must execute program 30 to 60 times per second in order to draw all the component lines of a picture. Program executed by DPU is in main memory which is shared by the general CPU and DPU. Application program and graphics subroutine package reside in main memory and execute on general CPU. Graphics package creates a display program of DPU instruction and tells the DPU where to start the program. DPU then asynchronously executes the display program until told to stop. Jump instruction transfers control back to start so display continues to be refreshed without CPU intervention.
Difference between Random and Raster System
| Raster Scan System | Random Scan System | |
| Resolution | It has poor or less Resolution because picture definition is stored as a intensity value. | It has High Resolution because it stores picture definition as a set of line commands. |
| Electron-Beam | Electron Beam is directed from top to bottom and one row at a time on screen, but electron beam is directed to whole screen. | Electron Beam is directed to only that part of screen where picture is required to be drawn, one line at a time so also called Vector Display. |
| Cost | It is less expensive than Random Scan System. | It is Costlier than Raster Scan System. |
| Refresh Rate | Refresh rate is 60 to 80 frame per second. | Refresh Rate depends on the number of lines to be displayed i.e 30 to 60 times per second. |
| Picture Definition | It Stores picture definition in Refresh Buffer also called Frame Buffer. | It Stores picture definition as a set of line commands called Refresh Display File. |
| Line Drawing | Zig – Zag line is produced because plotted value are discrete. | Smooth line is produced because directly the line path is followed by electron beam . |
| Realism in display | It contains shadow, advance shading and hidden surface technique so gives the realistic display of scenes. | It does not contain shadow and hidden surface technique so it can not give realistic display of scenes. |
| Image Drawing | It uses Pixels along scan lines for drawing an image. | It is designed for line drawing applications and uses various mathematical function to draw. |
Color Generating Techniques of CRT Monitors
Beam Penetration method
This CRT is similar to the simple CRT, but it makes use of multi coloured phosphorus of number of layers. Each phosphorus layer is responsible for one colour. All other arrangements are similar to simple CRT. It can produce a maximum of 4 to 5 colures
The organization is something like this – The red, green and blue phosphorus are coated in layers – one behind the other. If a low speed beam strikes the CRT, only the red colored phosphorus is activated, a slightly accelerated beam would activate both red and green (because it can penetrate deeper) and a much more activated one would add the blue component also.
But the basic problem is a reliable technology to accelerate the electronic beam to precise levels to get the exact colors – it is easier said than done. However, a limited range of colors can be conveniently produced using the concept.
Shadow-mask methods are commonly used in raster-scan systems (including color TV) because they produce a much wider range of color than the beam penetration method. A shadow-mask CRT has three phosphor color dots at each pixel position. One phosphor dot emits a red light, another emits a green light, and the third emits a blue light. This type of CRT has three electron guns, one for each color dot, and a shadow- mask grid just behind the phosphor –coated screen.Fig.below illustrates the delta-delta shadow-mask method, commonly used in color CRT systems. The three electron beam are deflected and focused as a group onto the shadow mask, which contains a series of holes aligned with the phosphor-dot patterns. When the three beams pass through a hole in the shadow mask, they activate a dot triangle, which appears as a small color spot the screen the phosphor dots in the triangles are arranged so that each electron beam can activate only its corresponding color dot when it passes through the shadow mask.
DVST – Direct View Storage Tube
Conceptually the Direct View Storage Tube (DVST) behaves like a CRT with highly persistent phosphor. Pictures drawn on there will be seen for several minutes (40-50 minutes) before fading. It is similar to CRT as far as the electronic gun and phosphor-coated mechanisms are concerned. But instead of the electron beam directly writing the pictures on the phosphor coated CRT screen, the writing is done with the help of a fine-mesh wire grid.
The grid made of very thin, high quality wire, is located with a dielectric and is mounted just before the screen on the path of the electron beam from the gun. A pattern of positive charges is deposited on the grid and this pattern is transferred to the phosphor coated CRT by a continuous flood of electrons. This flood of electrons is produced by a “flood gun” (This is separate frame the electron gun that produces the main electron beam).
Just behind the storage mesh is a second grid called the collector. The function of the collector is to smooth out the flow of flood electrons. Since a large number of electrons are produced at high velocity by the flood gun, the collector grid, which is also negatively charged reduces, the acceleration on these electrons and the resulting low velocity flood pass through the collector and get attracted by the positively charged portions of the storage mesh (Since the electrons are negatively charged), but are repelled by the other portions of the mesh which are negatively charged (Note that the pattern of positive charges residing on the storage mesh actually defines the picture to be displayed).
A flat panel display
A flat panel display is a television, monitor or other display appliance that uses a thin panel design instead of a traditional cathode ray tube (CRT) design. These screens are much lighter and thinner, and can be much more portable than traditional televisions and monitors. They also have higher resolution than older models.
Types LCD,LED
What is a LCD(Liquid Crystal Display)?
A liquid crystal display or LCD draws its definition from its name itself. It is combination of two states of matter, the solid and the liquid. LCD uses a liquid crystal to produce a visible image. Liquid crystal displays are super-thin technology display screen that are generally used in laptop computer screen, TVs, cell phones and portable video games. LCD’s technologies allow displays to be much thinner when compared to cathode ray tube (CRT) technology.
Liquid crystal display is composed of several layers which include two polarized panel filters and electrodes. LCD technology is used for displaying the image in notebook or some other electronic devices like mini computers. Light is projected from a lens on a layer of liquid crystal. This combination of colored light with the grayscale image of the crystal (formed as electric current flows through the crystal) forms the colored image. This image is then displayed on the screen.
Liquid crystal display screen works on the principle of blocking light rather than emitting light. LCD’s requires backlight as they do not emits light by them. We always use devices which are made up of LCD’s displays which are replacing the use of cathode ray tube. Cathode ray tube draws more power compared to LCD’s and are also heavier and bigger.
Simple facts that should be considered while making an LCD:
- The basic structure of LCD should be controlled by changing the applied current.
- We must use a polarized light.
- Liquid crystal should able be to control both of the operation to transmit or can also able to change the polarized light.
The main principle behind liquid crystal molecules is that when an electric current is applied to them, they tend to untwist. This causes a change in the light angle passing through them. This causes a change in the angle of the top polarizing filter with respect to it. So little light is allowed to pass through that particular area of LCD. Thus that area becomes darker comparing to others.
Advantages of an LCD’s:
- LCD’s consumes less amount of power compared to CRT and LED
- LCD’s are consist of some microwatts for display in comparison to some mill watts for LED’s
- LCDs are of low cost
- Provides excellent contrast
- LCD’s are thinner and lighter when compared to cathode ray tube and LED
Disadvantages of an LCD’s:
- Require additional light sources
- Range of temperature is limited for operation
- Low reliability
- Speed is very low
- LCD’s need an AC drive
LED monitor
Short for light-emitting diode monitor, an LED monitor or LED display is a flat screen, flat panel computer monitor or television. It has a very short depth and is light in terms of weight. The actual difference between this and a typical LCD monitor is the backlighting. The first LCD monitors used CCFL instead of LEDs to illuminate the screen
LED Monitors
In the previous decade, the display technology has changed significantly. LED displays are one of the latest developments.
Fig. 8 : A Representational Image of a LED Monitor
In this field. LED monitors use light emitting diodes that acts as a performance booster in the monitors. Basically LED monitors are the LCD monitors with a LED backlight to power up the LCD panel. It means that LEDs are placed behind or around the LCD panel to enhance the luminosity and video definition of the monitor screen.
As we have seen in the above section of LCD monitors, they use a cold cathode light as backlight. In the LED monitors all the concepts are same except this backlight, which is replaced by LEDs.
There are three different types of LED monitors available based on the manner how the diodes are arranges in the monitor. These are – Direct LEDs, Edge LEDs and RGB LEDs. Both Edge and Direct LED display monitors use white diodes that are used to illuminate the LCD panel to produce the improved picture quality. The arrangement of LEDs in the monitor is shown in the below image:
Fig. 9: An Image Showing Comparison of Direct LED and Edge LED Technology
In the Direct LEDs display, white diodes are placed all over the panel to produce higher quality image while the Edge LEDs display uses LEDs only on the borders of the LCD panel. Direct LEDs are generally used in the production of high definition TV whereas the Edge LEDs is mainly used in the production of computer screens. RGB LEDs display is better among the three types of LED monitors as it uses red, green and blue diodes to produce the lifelike images with amazing contrast ratio
.
LED monitor advantages
LED monitors offer many benefits when compared to those that are CCFL lit including:
- Typically are less expensive.
- Broader dimming range.
- Overall more reliable.
- They run at a lower temperature, and consume much less power, as few as 20 watts.
- Higher dynamic contrast ratio.
- Longer lifespan and less environmental impact.
What is Plasma?
Plasma is referred to be the main element of a fluorescent light. It is actually a gas including ions and electrons. Under normal conditions, the gals has only uncharged particles. That is, the number of positive charged particles [protons] will be equal to the number of negative charged particles [electrons]. This gives the gas a balanced position.
Suppose you apply a voltage onto the gas, the number of electrons increases and causes an unbalance. These free electrons hit the atoms, knocking loose other electrons. Thus, with the missing electron, the component gets a more positive charge and so becomes an ion.
In plasma, photons of energy are released, if an electrical current is allowed to pass through it. Both the electrons and ions get attracted to each other causing inter collision. This collision causes the energy to be produced. Take a look at the figure illustrated below.
Working of Plasma display
The working of the pixels has been explained earlier. Each pixel has three composite coloured sub-pixels. When they are mixed proportionally, the correct colour is obtained.
There are thousands of colures depending on the brightness and contrast of each. This brightness is controlled with the pulse-width modulation technique. With this technique, it controls the pulse of the current that flows through all the cells at a rate of thousands of times per seconds.
Characteristics of Plasma Display
- Plasma displays can be made upto large sizes like 150 inches diognal.
- Very low-luminance “dark-room” black level.
- Very high contrast.
- The plasma display panel has a thickness of about 2.5 inches, which makes the total thickness not more than 4 inches.
- For a 50 inch display, the power consumption increases from (50-400) watts in accordance with images having darker colures.
- All displays are sold out in shop mode which consumes more power than the above described. It can be changed to home mode.
- Has a life-time of almost 100,000 hours. After this period, the brightness of the TV reduces to half.
Import Terms for 2 marks
Resolution
Aspect ratio is the ratio of the width of an image to the height of the image. This ratio is expressed as x:y, and differs in case of different images used in photography, television, computer applications and so on. Changing this ratio may distort the images. The resolution of an image is the total number of pixels displayed on your computer or television screen. Generally, the higher the resolution, the higher is the quality of the image.
Pixel
The term “pixel” is actually short for “Picture Element.” These small little dots are what make up the images on computer displays, whether they are flat-screen (LCD) or tube (CRT) monitors. The screen is divided up into a matrix of thousands or even millions of pixels.
Frame buffer
A frame buffer (frame buffer, or sometimes frame store) is a portion of random-access memory (RAM) containing a bitmap that drives a video display. It is a memory buffer containing data representing all the pixels in a complete video frame.
Refresh rate
The refresh rate of your display refers to how many times per second the display is able to draw a new image. This is measured in Hertz (Hz). For example, if your display has a refresh rate of 144Hz, it is refreshing the image 144 times per second.
Aspect ratio
Aspect ratio is the ratio between width of an image and the height of an image. It is commonly explained as two numbers separated by a colon (8:9). This ratio differs in different images, and in different screens.
Display Processor
Display Processor is the interpreter or a hardware that converts display processor code into picture. The Display Processor converts the digital information from CPU to analog values.
Persistence
Persistence is defined as the time it takes the emitted light from the screen to decay to one tenth of its original intensity.
Workstations
1) A workstation is a computer intended for individual use that is faster and more capable than a personal computer. It’s intended for business or professional use (rather than home or recreational use). Workstations and applications designed for them are used by small engineering companies, architects, graphic designers, and any organization, department, or individual that requires a faster microprocessor, a large amount of random access memory (RAM), and special features such as high-speed graphics adapters. Historically, the workstation developed technologically about the same time and for the same audience as the UNIX operating system, which is often used as the workstation operating system. Among the most successful makers of this kind of workstation are Sun Microsystems, Hewlett-Packard, DEC, and IBM.
A color model is a system that uses three primary colors to create a larger range of colors. There are different kinds of color models used for different purposes, and each has a slightly different range of colors they can produce. The whole range of colors that a specific type of color model produces is called a color space. All color results from how our eye processes light waves, but depending on the type of media, creating that color comes from different methods.
The RGB Color Model
There are two basic kinds of color models, additive and subtractive. Let’s look at an additive color model first. The most common one is Red/Green/Blue, usually referred to as RGB. This color model uses light to create color, and it is used for digital media. When you play a game on your smart phone or watch an action movie on TV, you are seeing color in an RGB color space. RGB is called an additive color model because when the three colors of light are shown in the same intensity at the same time, they produce white. If all the lights are out, they create black.
| Image of a RGB Color Model. The middle is where all the colors at equal strength form white |
The CMYK Color Model
When printing color images, you can’t use colored light, and that means images can not be printed in RGB. That is where the other color model comes in. A subtractive color model adds pigment in the form of ink or dye that causes an absence of white. The most common subtractive color model is Cyan/Magenta/Yellow/Black, usually referred to as CMYK. It is what printers use, and you will sometimes also see it called process color because it is used in the four color printing process. To print a color image on paper, you have to use ink. Starting with the bright white paper surface, the colors are printed according to a pattern. The more color is applied, the more the white surface is masked. That is why it is called subtractive. But why the addition of black ink? Because when all the colors are mixed, they create a muddy brown. To get rich deep black, you have to use black ink.
A lookup table
In computer science, a lookup table is an array that replaces runtime computation with a simpler array indexing operation. The savings in terms of processing time can be significant, since retrieving a value from memory is often faster than undergoing an “expensive” computation or input/output operation.[1] The tables may be precalculated and stored in static program storage, calculated (or “pre-fetched”) as part of a program’s initialization phase (memoization), or even stored in hardware in application-specific platforms.
Click here to Download Unit-1 Notes
Course Features
- Lectures 0
- Quizzes 0
- Skill level All levels
- Students 7
- Assessments Self
