Analysis and Interpretation of financial Statements
Meaning Of Financial statement analysis:
Financial statement analysis is the process of analyzing a company’s financial statements for decision-making purposes. External stakeholders use it to understand the overall health of an organization as well as to evaluate financial performance and business value. Internal constituents use it as a monitoring tool for managing the finances.
In Nutshell:
- Financial statement analysis is used by internal and external stakeholders to evaluate business performance and value.
- Financial accounting calls for all companies to create a balance sheet, income statement, and cash flow statement which form the basis for financial statement analysis.
- Types of Financial Analysis:
(1) On the basis of material used: According to material used, financial analysis can be of two types
-
- External analysis
- internal analysis
(a) External Analysis. This analysis is done by outsiders who do not have access to the detailed internal accounting records of the business firm. These outsiders include investors, potential investors, creditors, potential creditors, government agencies, credit agencies, and the general public. For financial analysis, these external parties to the firm depend almost entirely on the published financial statements. External analysis, thus serves only a limited purpose. However, the recent changes in the government regulations requiring business firms to make available more detailed information to the public through audited published accounts have considerably improved the position of the external analysis.
(b) Internal Analysis. The analysis conducted by persons who have access to the internal accounting records of a business firm is known as internal analysis. Such an analysis can, therefore, be perfo rmed by executives and employees of the organization as well as government agencies which have statutory powers vested in them. Financial analysis for managerial purposes is the internal type of analysis that can be effected depending upon the purpose to be achieved.
2.On the basis of modus operandi. According to the method of operation followed in the analysis, financial analysis can also be of two types:
(a) horizontal analysis
(b) vertical analysis
(a) Horizontal Analysis. Horizontal analysis refers to the comparison of financial data of a company for several years. The figures for this type of analysis are presented horizontally over a number of columns. The figures of the various years are compared with standard or base year. A base year is a year chosen as beginning point. This type of analysis is also called ‘Dynamic Analysis’ as it is based on the data from year to year rather than on data of any one year. The horizontal analysis makes it possible to focus attention on items that have changed significantly during the period under review. Comparison of an item over several periods with a base year may show a trend developing. Comparative statements and trend percentages are two tools employed in horizontal analysis.
(b) Vertical Analysis. Vertical analysis refers to the study of relationship of the various items in the financial statements of one accounting period. In this types of analysis the figures from financial statement of a year are compared with a base selected from the same year’s statement. It is also known as ‘Static Analysis’. Common—size financial statements and financial ratios are the two tools employed in vertical analysis. Since vertical analysis considers data for one time period only, it is not very conducive to a proper analysis of financial statements. However, it may be used along with horizontal analysis to make it more effective and meaningful.
3.On the basis or entities On the basis of entities involved in the analysis, financial analysis can also be of two types
(a) Cross sectional or inter-firm analysis,
(b) Time series or intra-firm analysis.
- Cross Sectional or Inter-firm Analysis. Cross sectional analysis involves comparison of financial data of a firm with other firms (competitors) or industry averages for the same time
- Time Series or Intra-firm Analysis. Time series analysis involves the study of performance of the same firm over a period of time.
4.On the basis or time horizon or objective or analysis. On the basis of time horizon, financial analysis can be classified under two categories
(a) short-term analysis.
(b) long-term analysis.
(a) Short-term Analysis. Short-term analysis measures the liquidity position of a firm, i.e. the short-term paying capacity of a firm or the firm’s ability to meet its current obligations.
(b) Long-term Analysis. Long-term analysis involves the study of firm’s ability to meet the interest costs and repayment schedules of its long-term obligations. The solvency, stability and profitability are measured under this type of analysis
TOOLS/METHODS OR DEVICES OF FINANCIAL ANALYSIS:
The analysis and interpretation of financial statements is used to determine the financial position and results of operations as well. A number of methods or devices are used to study the relationship between different statements. An effort is made to use those devices which clearly analyze the position of the enterprise. The following methods of analysis are generally used: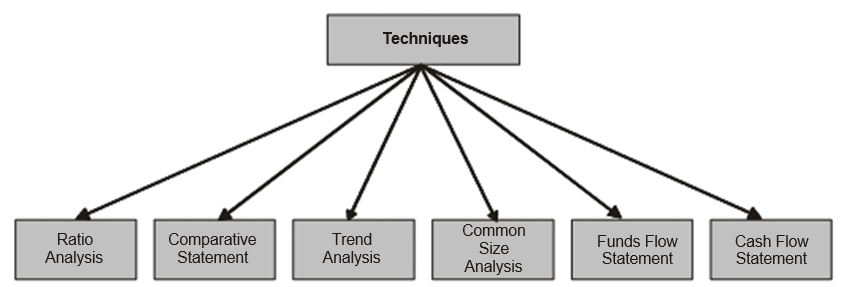
The first three methods, i.e., comparative statements, trend analysis and common—size statements are discussed in the following pages of this chapter. Funds flow, cash flow, ratio analysis and cost -volume- profit analysis have been discussed in separate chapters later
1. COMPARATIVE STATEMENTS
Comparative financial statement is a tool of financial analysis used to study the magnitude and direction of changes in the financial position and performance of a firm over a period of time. The preparation of comparative statements is based on the premise that a statement covering a period of a number of years is more meaningful and significant than for a single year only.
The comparative financial statements are statements of the financial position at different periods; of time. The elements of financial position are shown in a comparative form so as to give an idea of financial position at two or more periods. Any statement prepared in a comparative form will be covered in comparative statements. From practical point of view, generally, two financial statements (balance sheet and income statement) are prepared in comparative form for financial analysis purposes. Not only the comparison of the figures of two periods but also be relationship between balance sheet and income statement enables an in depth study of financial position and operative results. The comparative statement may show:
- Absolute figures (rupee amounts).
- Changes in absolute figures e., increase or decrease in absolute figures.
- Absolute data in terms of percentages
- Increase or decrease in terms of percentages
- Comparisons expressed in terms of ratios
- Percentage of totals
- Objectives or Purpose of Comparative Financial Statements
The analyst is able to draw useful conclusions when figures are given in a comparative position. The figures of sales for a quarter, half —year or one year may tell only the present position of sales efforts. When sales figures of previous periods are given along with the figures of current periods then the analyst will be able to study the trends of sales over different periods of time. Similarly, comparative figures will indicate the trend and direction of financial position and operating results.The important objectives of comparative financial statements are as under:
- To indicate the trend and direction of financial position and operating
- To judge the strengths and weaknesses of a firm in terms of liquidity, solvency and
- To help the management in planning and
- To indicate the magnitude and direction of changes in various elements of financial
- To enhance the usefulness of financial The financial data will be comparative only when same accounting principles are used in preparing these statements. In case of any deviation in the use of accounting principles this fact must be mentioned at the foot of financial statements and the analyst should be careful in using these statements.
- The two comparative statements are (I) Balance sheet, and (ii) Income statement.
(I) COMPARATIVE BALANCE SHEET
Comparative balance sheet of an enterprise is prepared to show different assets, liabilities and capital as on two or more dates so as to compare and ascertain any increase or decrease in absolute items and also percentages changes. The comparative balance sheet analysis, in the words of Foulke, “is the study of the trend of the same items, group of items and computed items in two or more balance sheets of the same business enterprise on different dates.” The changes in the balance sheet items reflect the conduct of a business. The changes can be observed by comparison of the balance sheet at the beginning and at the end of a period and these changes can help in forming an opinion about the progress of an enterprise.
Advantages of Comparative Balance Sheet:
- . The comparative balance sheet is more useful than a simple balance sheet as it shows data which may be used to study the trend of a business enterprise.
- The emphasis, in a single balance sheet, is on status, whereas in a comparative balance sheet the emphasis is on Thus, it is a dynamic statement.
- It helps in forming an opinion about the progress of an enterprise.
- It can be used as a tool in analysing and evaluating the financial position of a firm over a period of number of years.
- Format of Preparing a Comparative Balance Sheet a comparative balance sheet contains the following columns:

(ii)COMPARATIVE INCOME STATEMENT OR PROFIT AND LOSS ACCOUNT
The income statement gives the results of the operations of a business. It shows the net profit or net loss account of business operations. The comparative income statement gives an idea of the progress of a business over a period of time. The changes in absolute data in money values and percentages can be determined to analyse the profitability of the business
- Objectives of Comparative Income Statement: The important objectives of preparing a comparative income statement are as follows:
- To analyse and evaluate the operating results of a business.
- To indicate the trend and direction of incomes and expenditures in terms of absolute money values and percentages.
- To enhance the usefulness of an income statement.
- To help the management in planning and forecasting the profits.
Format for Preparing a Comparative Income Statement
A comparative income statement, like a comparative balance sheet contains the following columns:

2. COMMON SIZE STATEMENTS:
The common size statements, balance sheet and income statement, are shown in analytical percentages. The figures are shown as percentages of total assets, total liabilities and total sales. The total assets are taken as 100 and different assets are expressed as a percentage of the total. Similarly, various liabilities are taken as a part of total liabilities. These statements are also known as component percentage or 100 per cent statements because every individual item is stated as a percentage of the total 100. The short— comings in comparative statements and trend percentages where changes in items could not be compared with *the totals have been covered up. The analyst is able to assess the figures in relation to total values.
There are two types of common size statement :
(1) Common Size Balance sheet
(2) Common size Income statement.
(1) COMMON-SIZE BALANCE SHEET
A statement in which balance sheet items are expressed as the ratio of each asset to total assets and the ratio of each liability is expressed as a ratio of total liabilities is called common—size balance sheet .The common—size balance sheet can be used to compare companies of differing size. The comparison of figures in different periods is not useful because total figures may be affected by a number of factors. It is not possible to establish standard norms for various assets. The trends of figures from year to year may not be studied and even they may not give proper results.

(11) COMMON SIZE INCOME STATEMENT
The items in income statement can be shown as percentages of sales to show the relation of each item to sales. A significant relationship can be established between items of income statement and volume of sales. The increase in sales will certainly increase selling expenses and not administrative or financial expenses. In case the volume of sales increases to a considerable extent, administrative and financial expenses may go up. In case the sales are declining, the selling expenses should be reduced at once. So, a relationship is established between sales and other items in income statement and this relationship is helpful in evaluating operational activities of the enterprise.

3. TREND ANALYSIS:
The financial statements may be analysed by computing trends of series of information. This method determines the direction upwards or downwards and involves the computation of the percentage relationship that each statement item bears to the same item in base year. The information for a number of years is taken up and one year, generally the first year, is taken as a base-year. The figures of the base year are taken as 100 and trend ratios for other years are calculated on the basis of’ base year:-The analyst is able to see the trend of figures, whether upward or downward.
For example, if sales figures for the year 2008 to 2013 are to be studied, then sales of 2008 will be taken as 100 and the percentage of sales for all other years will be calculated in relation to the base year, i.e., 2008
Procedure for Calculating Trends:
(l) One year is taken as a base year. Generally, the first or the last is taken as base year.
- The figures of base year are taken as 100.
- Trend percentages are calculated in relation to base If a figure in other year is less than the figure in base year the trend percentage will be less than 100 and it will be more than 100 if figure is more than base year figure.
Each year’s figure is divided by the base year’s figure. The interpretation of trend analysis involves a cautious study. The mere increase or decrease in trend percentage may give misleading results if studied in isolation. An increase of 20% in current assets may be treated favourable. If this increase in current assets is accompanied by an equivalent increase in current liabilities, then this increase will be unsatisfactory. The increase in sales may not increase profits if the cost of production has also gone up.
The base period should be carefully selected. The base period should be a normal period. The price level changes in subsequent years may reduce the utility of trend ratios. If the figure of the base period is very small, then the ratios calculated on this basis may not give a true idea about the financial data. The accounting procedures and conventions used for collecting data and preparation of financial statements should be similar, otherwise the figures will not be comparable.
- LIMITATIONS OF FINANCIAL ANALYSIS
Financial analysis is a powerful mechanism of determining financial strengths and weaknesses of a firm. But, the analysis is based on the information available in the financial statements. Thus, the financial analysis suffers from serious inherent limitations of financial statements as studied in the previous chapter.
The financial analyst has also to be careful about the impact of price level changes, window —dressing of financial statements, changes in accounting policies of a firm, accounting concepts and conventions, and personal judgement, etc. The readers are advised to relate the limitations of financial statements as given in the previous chapter and also the limitations of ratios as a tool of financial analysis as discussed in the chapter of Ratio Analysis later in the book.
Some of the important limitations of financial analysis are, however, summed up as below:
- It is only a study of interim reports
- Financial analysis is based upon only monetary information and none—monetary factors are
- It does not consider changes in price
- As the financial statements are prepared on the basis of a going concern, it does not give exact Thus accounting concepts and conventions cause a serious limitation to financial analysis.
- Changes in accounting procedure by a firm may often make financial analysis
- Analysis is only a means and not an end in The analyst has to make interpretation and draw his own conclusions. Different people may interpret the same analysis in different ways.